A1C Calculator
Convert your A1C to estimated average glucose by multiplying your A1C by 28.7 and subtracting 46.7. This free A1C calculator runs the published ADAG equation and translates values between percentages, mg/dL, and mmol/L.
How This A1C Calculator Works
This A1C calculator converts a hemoglobin A1C percentage into estimated average glucose with the standard formula: 28.7 multiplied by A1C minus 46.7. For example, an A1C of 5.9% results in 123 mg/dL or 6.8 mmol/L. The Centers for Disease Control and Prevention (CDC) classifies this value in the prediabetes range.
The formula comes from the 2008 A1c-Derived Average Glucose (ADAG) study published in Diabetes Care by Nathan and colleagues. Researchers evaluated 507 participants across 10 international centers. The cohort included 268 individuals with type 1 diabetes, 159 with type 2 diabetes, and 80 nondiabetic participants. The study collected roughly 2,700 glucose values per participant over 3 months. Laboratory A1C tests at 3 months were paired with continuous glucose monitoring and 7-point daily fingerstick logs. The American Diabetes Association uses this formula on its professional site and recommends the term estimated average glucose, or eAG.
| A1C (%) | Estimated Average Glucose (mg/dL) | Estimated Average Glucose (mmol/L) |
|---|---|---|
| 6.0% | 126 | 7.0 |
| 6.5% | 140 | 7.8 |
| 7.0% | 154 | 8.6 |
| 8.0% | 183 | 10.1 |
| 9.0% | 212 | 11.8 |
| 10.0% | 240 | 13.4 |
The A1C calculator also has a reverse calculation mode. This mode estimates an A1C from a 90-day average blood glucose reading. It applies the reversed formula: A1C = (average glucose + 46.7) ÷ 28.7. For example, a 90-day average of 126 mg/dL yields an estimated A1C of 6.0%. An estimate from average glucose cannot be used for diagnosis. Calculations run directly in your browser, and nothing is stored unless you use the optional email box.
What Your A1C Range Means
An A1C test reflects your average blood sugar level over the past 3 months. According to the CDC, a normal A1C is below 5.7%. The CDC defines prediabetes as 5.7% to 6.4%, while diabetes sits at 6.5% or above.
A single fingerstick check captures one moment. The CDC defines normal fasting blood sugar after an overnight fast as 99 mg/dL or below. Fasting glucose between 100 and 125 mg/dL indicates prediabetes. A fasting reading of 126 mg/dL or above indicates diabetes. The guide on A1C testing reviews what the test measures, ranges, and an estimated average glucose chart. The fasting glucose guide covers that single-morning test in more detail.
Many clinical laboratories outside the United States report A1C results in International Federation of Clinical Chemistry (IFCC) units of mmol/mol. The National Glycohemoglobin Standardization Program (NGSP) publishes the master conversion equation: NGSP = 0.09148 × IFCC + 2.152. Under that equation, 5.7% equals roughly 39 mmol/mol. An A1C of 6.5% equals about 48 mmol/mol.
When the Estimate Can Be Wrong
The CDC notes that several health factors falsely increase or decrease an A1C reading. These factors include severe anemia, kidney failure, liver disease, early or late pregnancy, blood loss, and blood transfusions. Sickle cell anemia and thalassemia also distort test results. Certain medicines, including opioids and some HIV medications, change readings as well.
In the ADAG trial, the linear regression produced an R² of 0.84. Nathan and colleagues found equations did not differ across subgroups defined by age, sex, diabetes type, race, ethnicity, or smoking status. The authors concluded that A1C levels can be expressed as eAG for most patients with type 1 and type 2 diabetes.
The reverse formula turns home monitor numbers into an estimate. That estimate cannot replace laboratory blood testing for medical diagnosis. The fasting insulin versus A1C comparison sets the two lab tests side by side. The insulin resistance calculator calculates the homeostasis model assessment of insulin resistance (HOMA-IR) from fasting insulin and glucose values.
What You'll Get
- Estimated average glucose (mg/dL and mmol/L) from the ADAG formula
- A1C in IFCC units (mmol/mol)
- Where the A1C falls in the CDC normal / prediabetes / diabetes ranges
- Estimated A1C from an average glucose (reverse mode)
How to test metabolic markers at home
You don't need a lab appointment to check your own metabolic markers — a few at-home kits mail you a collection kit and return physician-reviewed results online within days:
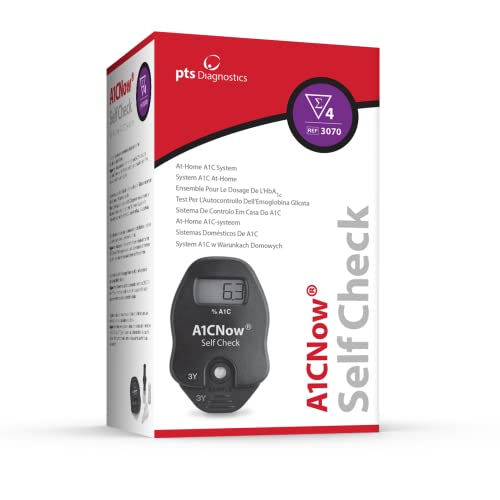
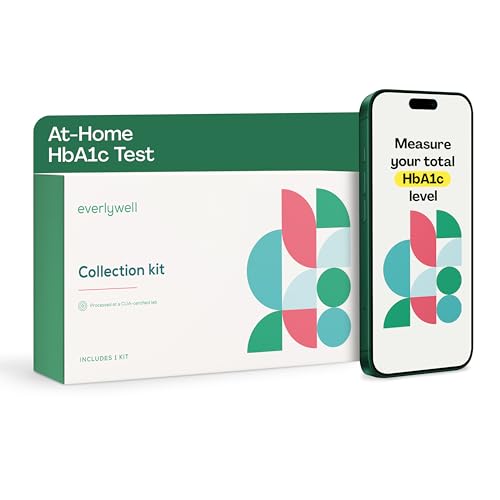
Prefer to order direct? The Everlywell HbA1c Test uses a CLIA-certified lab, physician-reviewed results, and prepaid return shipping.
What to Look For in a Continuous Glucose Monitor (CGM)
Over-the-counter CGMs like Dexcom Stelo and Abbott Lingo now sell without a prescription. Check the wear time (14–15 days per sensor), whether it reads to your phone or needs a separate device, and the monthly cost. For seeing how your own body responds to meals, a month or two is usually enough — you don't need to wear one forever.


Frequently Asked Questions
How do you calculate an A1C from average glucose?
Add 46.7 to your average glucose in mg/dL and divide that number by 28.7. For example, a 90-day average blood glucose of 126 mg/dL gives (126 + 46.7) ÷ 28.7 = 6.0%. This arithmetic reverses the ADAG study regression formula. The resulting number is an estimate from home readings and cannot be used for clinical diagnosis.
What is my average blood sugar for an A1C of 6.5?
An A1C of 6.5% corresponds to an estimated average glucose of 140 mg/dL, or 7.8 mmol/L. The American Diabetes Association lists this value using the linear formula 28.7 × A1C − 46.7. The CDC calls 6.5% or above the diabetes range.
How long does an A1C measure?
An A1C test measures your average blood sugar over the past 3 months. A single home glucose check captures one moment.
What A1C is prediabetes?
The CDC defines prediabetes as an A1C of 5.7% to 6.4%. A result below 5.7% is normal, while 6.5% or higher indicates diabetes. In international IFCC units, the 5.7% prediabetes threshold equals approximately 39 mmol/mol.
Can I calculate my A1C at home?
You can calculate an estimated A1C at home by reversing the ADAG formula with your 90-day meter or continuous monitor average. That calculated value is an estimate and is not a laboratory A1C test. It cannot be used to diagnose diabetes or prediabetes.
What is A1C in mmol/mol?
In many countries outside the United States, laboratories report A1C in IFCC units of mmol/mol instead of percentages. The master equation published by the NGSP links the two formats: NGSP = 0.09148 × IFCC + 2.152. Under that equation, 5.7% equals roughly 39 mmol/mol and 6.5% equals about 48 mmol/mol.
Topic updates
Get the weekly metabolic health roundup
Insulin resistance, blood sugar, visceral fat, GLP-1 plateaus, metabolic syndrome, and weight-loss physiology.
Affiliate disclosure: Some links above are affiliate or referral links and we may earn a commission at no extra cost to you. As an Amazon Associate we earn from qualifying purchases. This is general information and is not medical advice. Talk to your clinician before acting.