The HOMA-IR Formula Explained, With a Worked Example
Medically reviewed by Medical Advisory Board Last reviewed 2026-08-08
The exact equation behind HOMA-IR, a step-by-step numeric example, and what the result means.
HOMA-IR = (fasting insulin μIU/mL × fasting glucose mg/dL) ÷ 405. Here is the formula, a worked example, and how to read the result.
This article is for informational purposes only and is not medical advice. Consult a physician for medical guidance.
HOMA-IR is calculated as (fasting insulin in µIU/mL × fasting glucose in mg/dL) ÷ 405. The formula, short for Homeostatic Model Assessment of Insulin Resistance, converts two numbers already on many routine lab panels — fasting insulin and fasting glucose — into a single index that estimates how hard the pancreas is working to keep blood sugar in range. It was developed in the 1980s as a simplified stand-in for the far more invasive euglycemic clamp technique, the research gold standard for measuring insulin sensitivity.
Partner · Opt Health
Want insulin resistance treated, not just named?
Opt Health tests fasting insulin and HOMA-IR — the markers most panels skip — and treats the resistance itself with a physician-built plan rather than waiting for glucose to drift into the diabetic range.
Read Opt Health on insulin resistance →This page walks you through the math itself, including the formula, a full worked example, and the thresholds generally used to interpret the result. If you'd rather have the calculation done automatically, use the site's interactive insulin resistance calculator. This page is for readers who want to see, and understand, exactly what the tool is computing under the hood.
The HOMA-IR Formula
The standard HOMA-IR equation is:
HOMA-IR = (Fasting Insulin [µIU/mL] × Fasting Glucose [mg/dL]) ÷ 405
Both inputs need to come from a blood draw taken after an 8–12 hour fast, ideally in the morning before eating or drinking anything other than water, since both insulin and glucose shift significantly after meals. Our fasting insulin explainer covers why the fasting state matters and what a typical fasting insulin panel looks like.
A note on units: the constant 405 assumes glucose is reported in mg/dL, the standard unit in the United States. Labs that report glucose in mmol/L (common in Europe, Canada, and Australia) use a different constant — the formula becomes (fasting insulin × fasting glucose in mmol/L) ÷ 22.5. Using the wrong constant for your lab's units is the single most common HOMA-IR calculation error, so always check which unit your glucose result is reported in before doing the math by hand.
Worked Example: Calculating HOMA-IR Step by Step
Suppose a lab panel shows a fasting insulin of 12 µIU/mL and a fasting glucose of 95 mg/dL. Here is the calculation:
- Step 1: Multiply fasting insulin by fasting glucose: 12 × 95 = 1,140.
- Step 2: Divide by 405: 1,140 ÷ 405 ≈ 2.8.
A HOMA-IR of about 2.8 sits in a borderline-to-mildly-elevated range for many adults (see thresholds below), meaning this hypothetical result would generally prompt a closer look at diet, activity, and other metabolic markers rather than signal an emergency. Compare that to a second example: fasting insulin of 4 µIU/mL and fasting glucose of 85 mg/dL gives (4 × 85) ÷ 405 ≈ 0.8 — comfortably within the range most labs and researchers consider optimal insulin sensitivity.
Working through the numbers this way makes it clear why HOMA-IR moves the way it does: because insulin is multiplied by glucose rather than added to it, a rising fasting insulin level pushes the score up meaningfully even while glucose is still "normal" — which is exactly why HOMA-IR can flag insulin resistance years before fasting glucose alone would.
How to Interpret Your HOMA-IR Score
There is no single universally-adopted cutoff for HOMA-IR — thresholds vary somewhat by population, lab, and the research study cited — but the ranges below reflect commonly used, general benchmarks for non-pregnant adults:
| HOMA-IR Score | General Interpretation |
|---|---|
| Below ~1.0 | Optimal insulin sensitivity |
| ~1.0–1.9 | Normal / low-risk range for most adults |
| ~2.0–2.9 | Borderline; early insulin resistance possible |
| 3.0 and above | Suggestive of significant insulin resistance |
These bands are general guidance, not diagnostic cutoffs — a physician interprets HOMA-IR alongside the rest of a metabolic panel, body composition, family history, and symptoms rather than as a standalone verdict. For the fuller clinical picture, including which other labs are typically checked alongside HOMA-IR, see insulin resistance testing and the insulin resistance overview.
HOMA-IR vs the TG/HDL Ratio: Two Different Math Approaches
HOMA-IR is not the only formula used to estimate insulin resistance from routine labs. The triglyceride-to-HDL ratio (TG/HDL) is a simpler alternative that some clinicians use, especially when fasting insulin was not drawn: divide a standard lipid panel's triglyceride value by the HDL cholesterol value, both in mg/dL. A ratio above roughly 3.0 is commonly cited as suggestive of insulin resistance, though — like HOMA-IR — this cutoff varies across sources.
The two formulas are not interchangeable. HOMA-IR uses direct measurements of insulin and glucose and is generally considered the more direct proxy for insulin action, while TG/HDL is a downstream marker: it reflects a lipid pattern (high triglycerides, low HDL) that frequently accompanies insulin resistance but does not measure insulin directly. TG/HDL is useful because a standard lipid panel is drawn far more often than fasting insulin, but when both values are available, HOMA-IR is generally preferred as the closer estimate.
Limitations of the HOMA-IR Formula
HOMA-IR is a validated and widely used research and clinical tool, but it has real limitations worth understanding before treating a single number as definitive. It assumes a simplified model of insulin-glucose feedback and was originally validated against the euglycemic clamp in specific study populations, so its accuracy can vary somewhat across different ages, body compositions, and health conditions. Insulin assays also differ between labs and manufacturers, meaning a fasting insulin value — and therefore the resulting HOMA-IR — is not always perfectly comparable across different laboratories. Results can also swing with recent illness, poor sleep, stress, or an insufficiently fasted sample.
Because of this, HOMA-IR is best used as one data point tracked over time with the same lab, alongside symptoms, waist circumference, and other markers such as A1C and fasting glucose — not as a single number that alone confirms or rules out insulin resistance.
How to test metabolic markers at home
You don't need a lab appointment to check your own metabolic markers — a few at-home kits mail you a collection kit and return physician-reviewed results online within days:
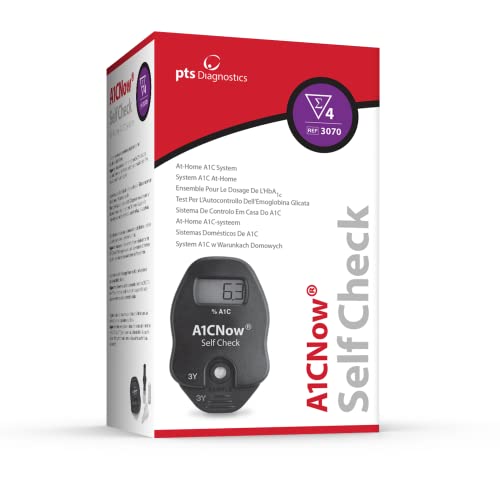
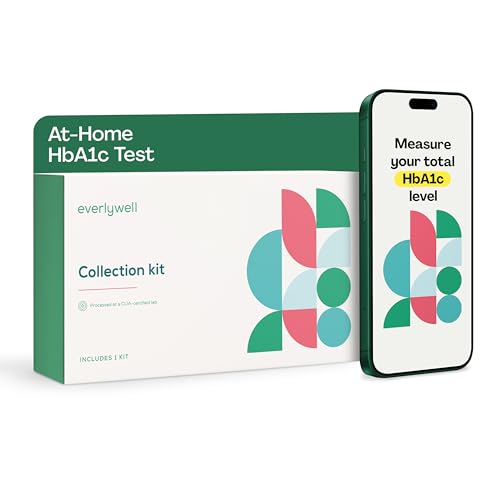
Prefer to order direct? The Everlywell HbA1c Test uses a CLIA-certified lab, physician-reviewed results, and prepaid return shipping.
What to Look For in a Continuous Glucose Monitor (CGM)
Over-the-counter CGMs like Dexcom Stelo and Abbott Lingo now sell without a prescription. Check the wear time (14–15 days per sensor), whether it reads to your phone or needs a separate device, and the monthly cost. For seeing how your own body responds to meals, a month or two is usually enough — you don't need to wear one forever.


What Makes a Good Fiber Supplement
For blood-sugar and cholesterol support you want SOLUBLE fiber — psyllium husk is the best studied. Start with one teaspoon and build up with plenty of water to avoid bloating, and take it 10–15 minutes before carb-heavy meals. Choose an unsweetened, additive-free powder or capsule.


Frequently Asked Questions
What is a normal HOMA-IR score?
Most sources consider a HOMA-IR below roughly 1.0 to reflect optimal insulin sensitivity, with values up to about 1.9 generally regarded as normal for most adults. Scores from about 2.0 to 2.9 are often labeled borderline, and 3.0 or higher is generally considered suggestive of insulin resistance. Exact cutoffs vary by lab and population, so results are best interpreted by a clinician alongside the rest of your metabolic panel.
What units does the HOMA-IR formula use?
The standard formula — (fasting insulin in µIU/mL × fasting glucose in mg/dL) ÷ 405 — assumes glucose is reported in mg/dL, the standard U.S. unit. If your lab reports glucose in mmol/L, the constant changes to 22.5 instead of 405. Using the wrong constant for your glucose unit will produce an incorrect HOMA-IR value.
Do I need to calculate HOMA-IR by hand?
No. You can enter your fasting insulin and fasting glucose values into the site's interactive insulin resistance calculator to get an instant result and interpretation. This page exists for readers who want to understand the underlying math and see a full worked example.
Is HOMA-IR more accurate than the TG/HDL ratio?
HOMA-IR is generally considered a closer proxy for insulin action because it uses direct fasting insulin and glucose measurements, while the TG/HDL ratio is an indirect marker based on a lipid pattern that often, but not always, accompanies insulin resistance. When fasting insulin has been measured, HOMA-IR is typically the preferred calculation; TG/HDL is a useful substitute when only a standard lipid panel is available.
Can HOMA-IR be high even with normal fasting glucose?
Yes, and this is one of the formula's most useful features. Because HOMA-IR multiplies insulin by glucose, a rising fasting insulin level can push the score into the borderline or high range well before fasting glucose itself climbs out of the normal range. This is why HOMA-IR can flag developing insulin resistance earlier than a standard glucose test alone.
Topic updates
Get the weekly metabolic health roundup
Insulin resistance, blood sugar, visceral fat, GLP-1 plateaus, metabolic syndrome, and weight-loss physiology.
Want insulin resistance handled by a physician who works from your labs? See how Opt Health does it →
Check Where You Stand
Take our free health assessment to understand your metabolic, hormonal, and recovery risk factors — and get personalized recommendations.
Take the Free Assessment →Free · Takes 5 minutes · Instant results
Related Guides
-
What Is Insulin Resistance? Causes, Symptoms & How to Reverse It
What insulin resistance is, how to test for it, and how to reverse it.
-
Hyperinsulinemia
Chronically high insulin: symptoms, causes, how it differs from insulin resistance, and how to reverse it.
-
Metabolic Syndrome — Diagnosis, Risks, and Treatment
The five diagnostic criteria and what they mean for your health.
See more related guides
-
Metabolic Syndrome vs Insulin Resistance — How the Two Terms Differ
Metabolic syndrome vs insulin resistance: the mechanism-vs-diagnosis distinction, and where PCOS overlaps.
-
Insulin Resistance Symptoms: 12 Warning Signs
12 clinical warning signs, from acanthosis nigricans to post-meal fatigue.
-
Blood Sugar Crash: Why It Happens and How to Stop It
Reactive hypoglycemia: causes, symptoms, and how to stabilize glucose.
-
Glucose Spikes After Eating: Causes and What to Do
Why blood sugar spikes after eating and what to do about it.
-
Fatigue After Eating: Why Food Makes You Tired
Post-meal fatigue explained — insulin, glucose, and the gut-brain axis.
Affiliate disclosure: The Metabolic Journal is reader-supported. Some links above are affiliate or referral links and we may earn a commission at no extra cost to you. As an Amazon Associate we earn from qualifying purchases. Products are chosen on the merits; commissions never influence what we recommend. This is general information, not medical advice — talk to your clinician before acting.